Optimizing Data Center Locations for Intel

In collaboration with Intel's Sustainability Team, this project aims to determine the optimal location for a new data center. Dashboards and visualizations were developed using Tableau to analyze energy production, demand, and renewable energy sources across different regions.

a image of Intel Data Center.

Energy Production Analysis

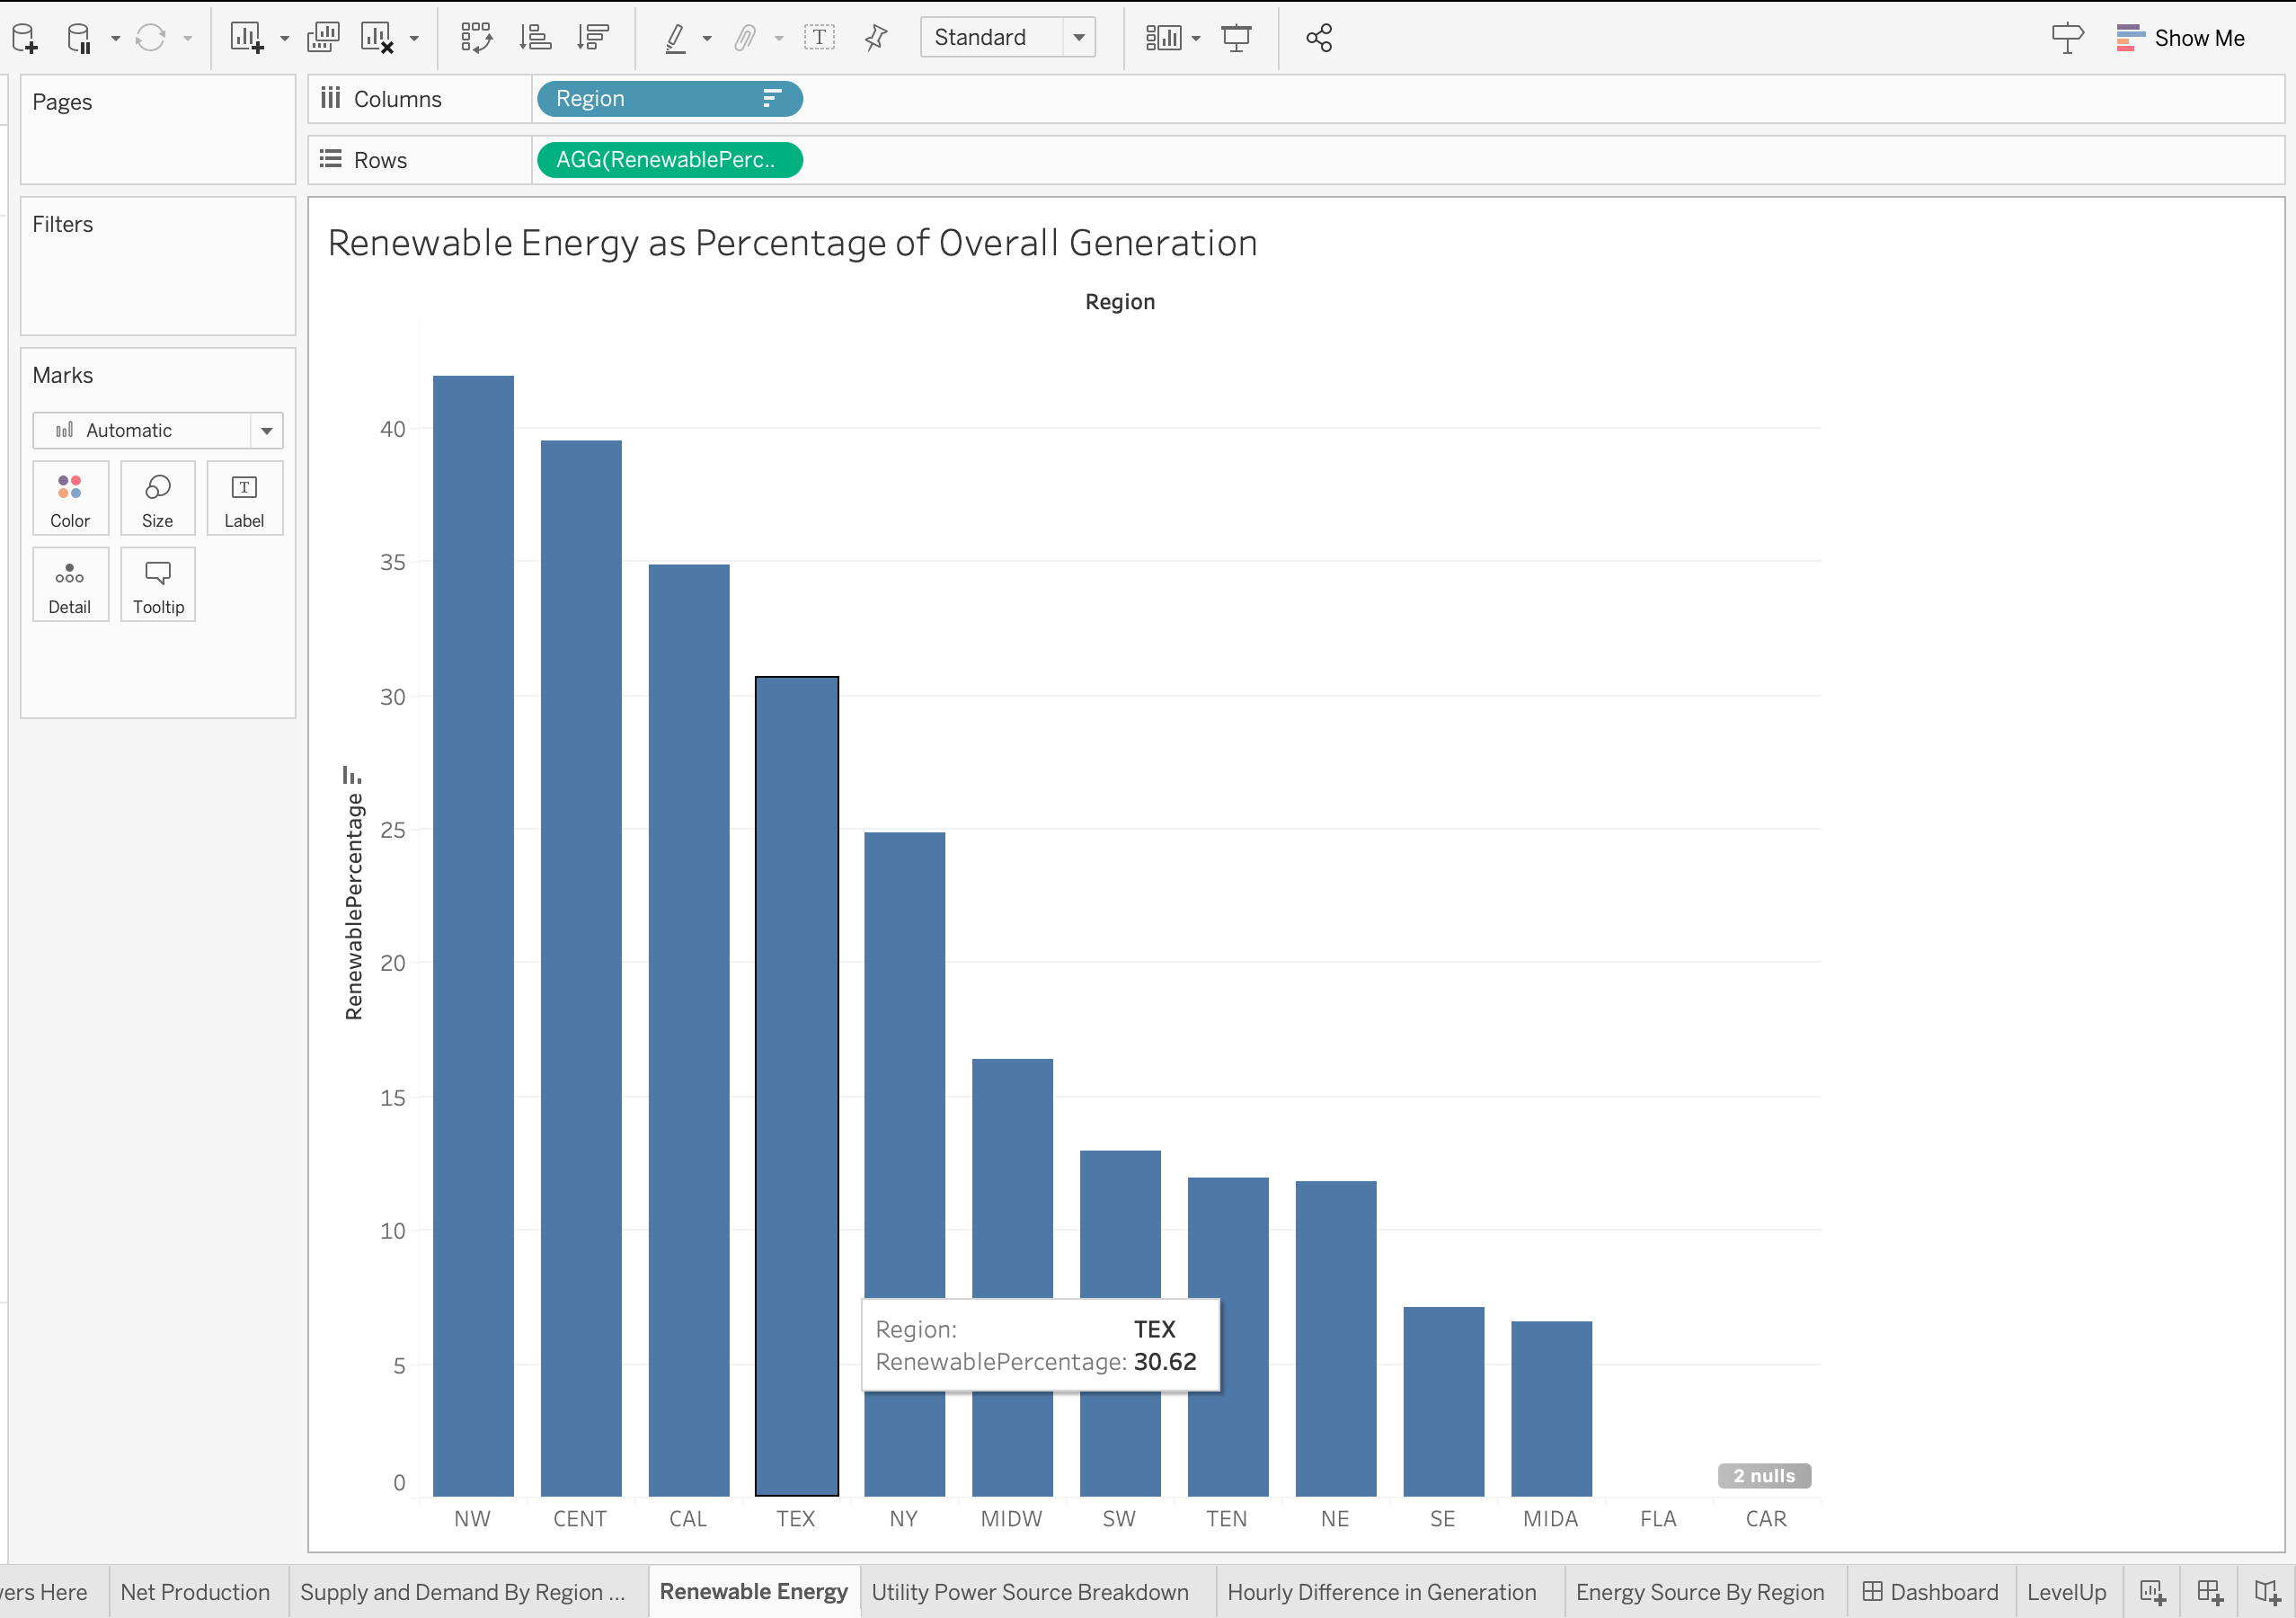
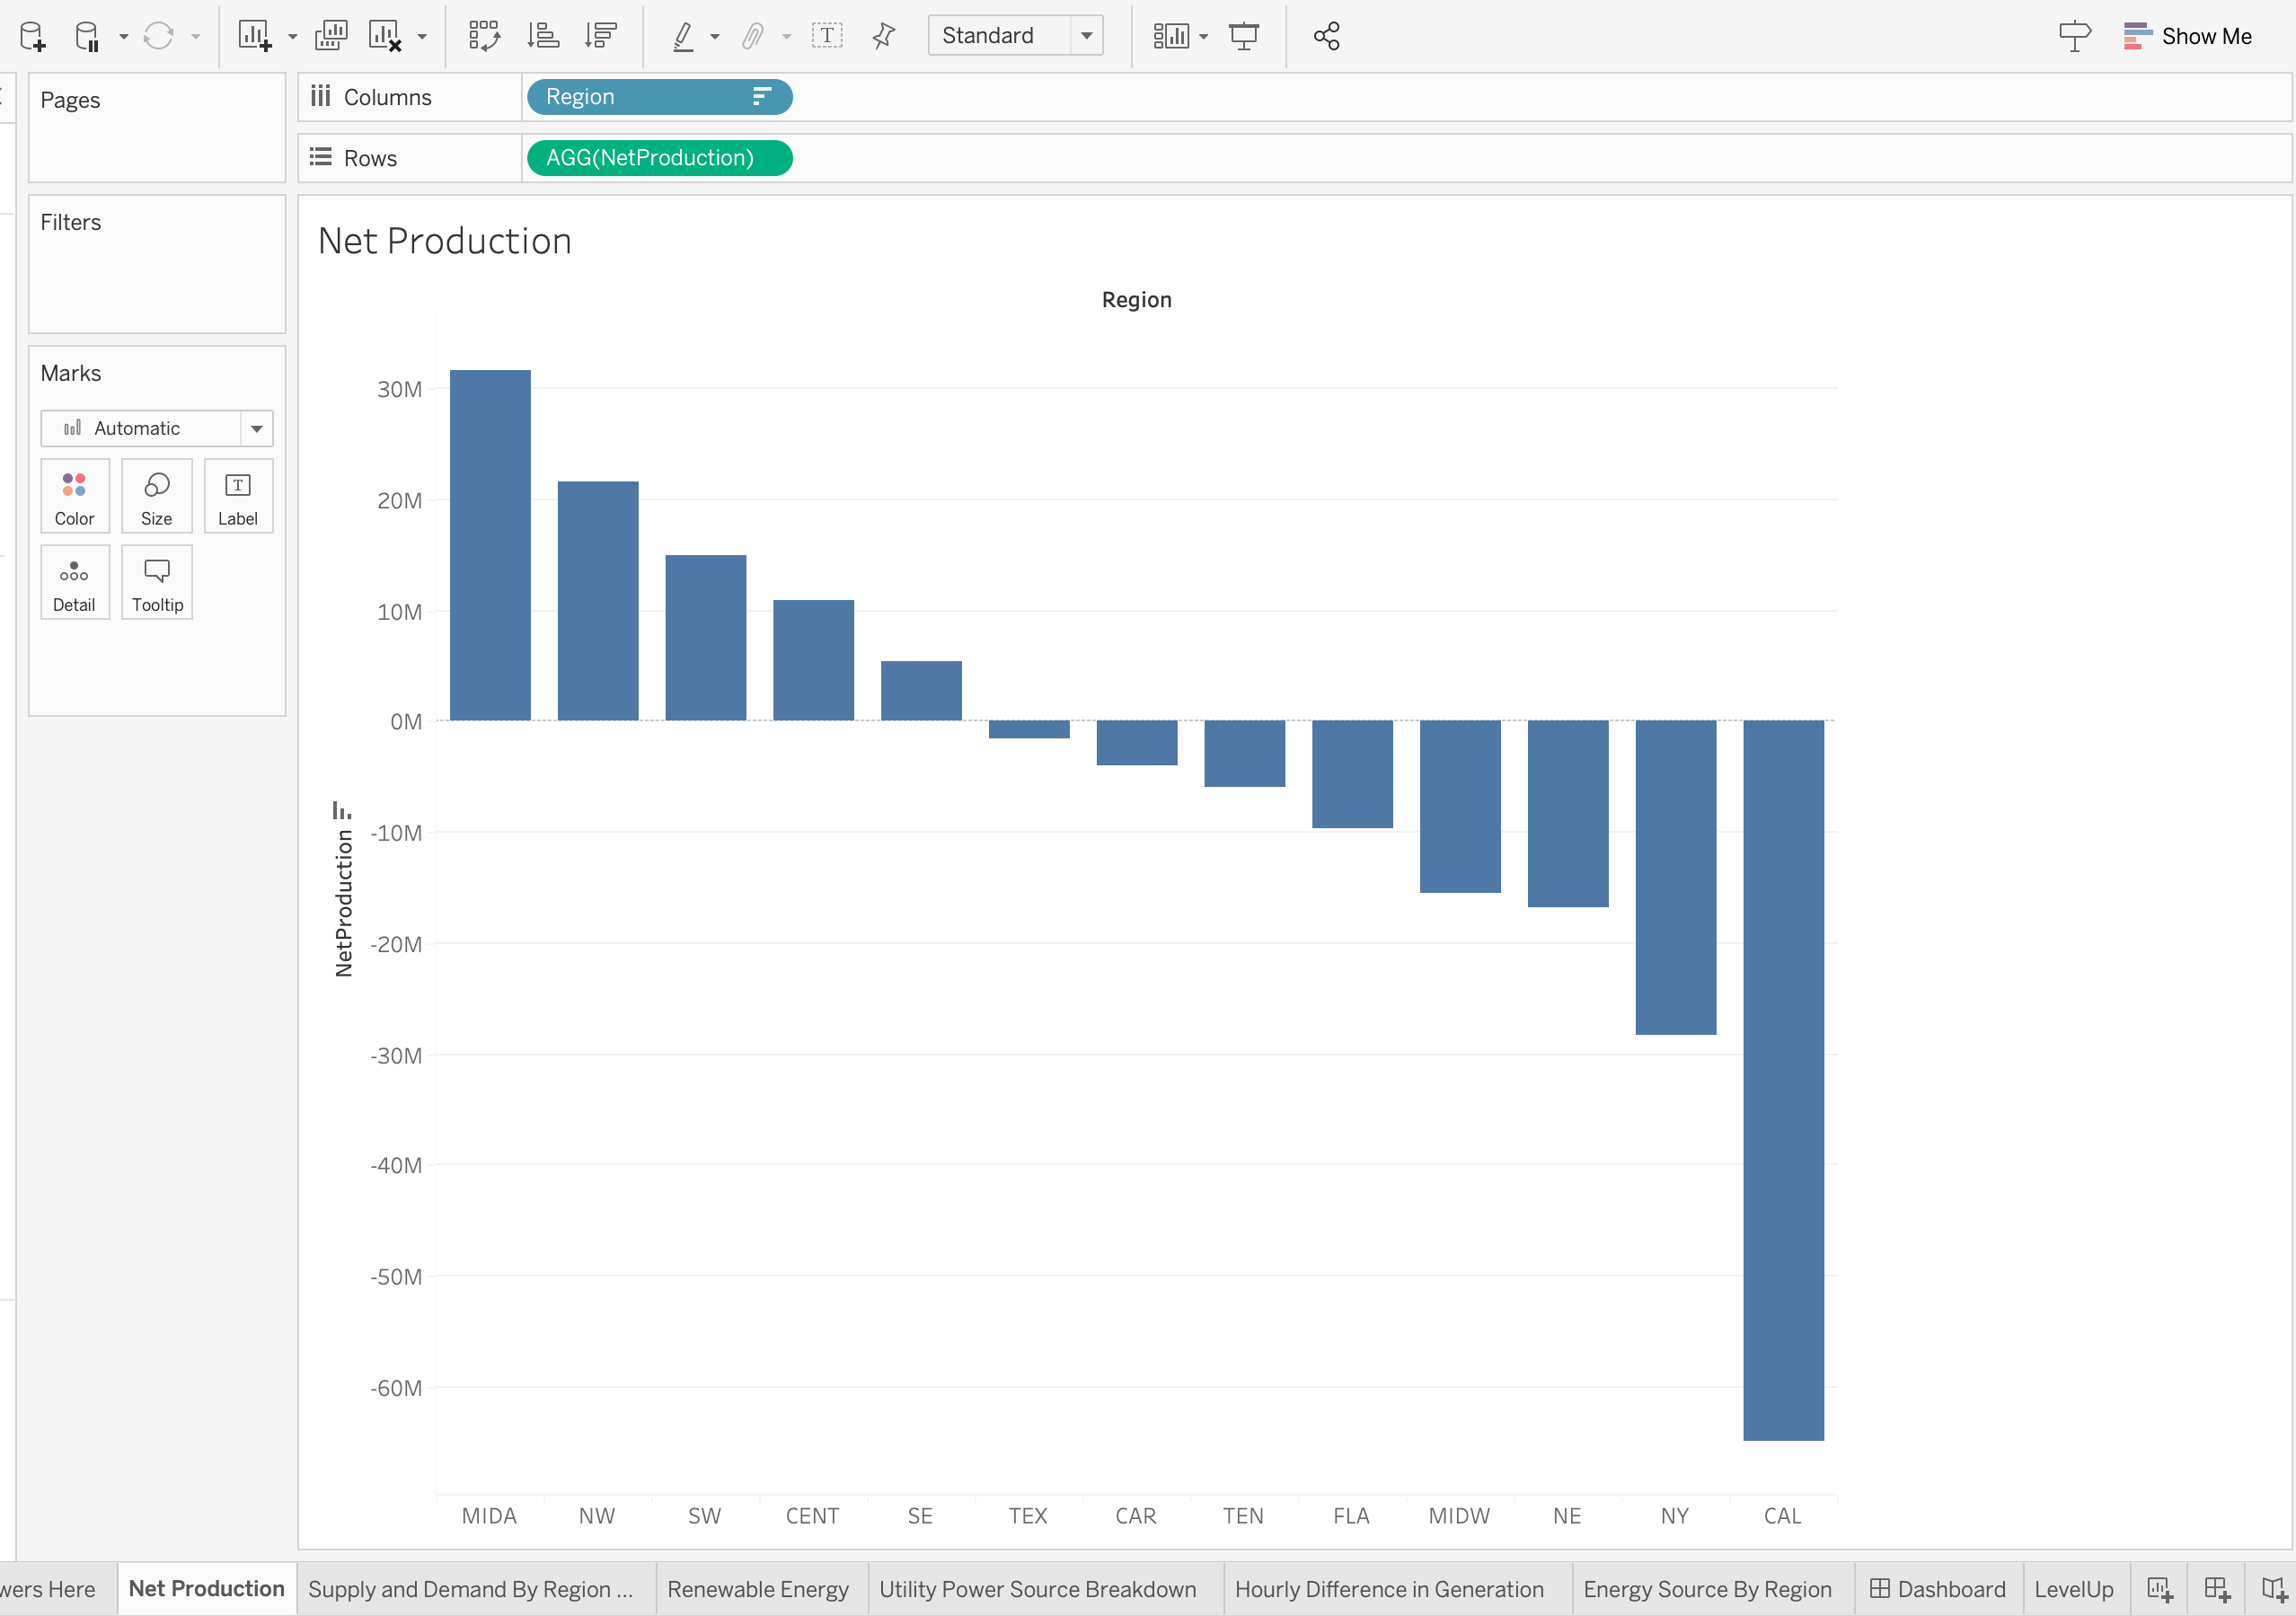
Bar charts were created to identify regions that are net energy producers, highlighting areas that generate more energy than they consume. Additionally, regions generating the highest percentage of renewable energy were visualized, aligning with Intel's sustainability goals.

a image of a chart in Tableau.

Energy Deman and Stability

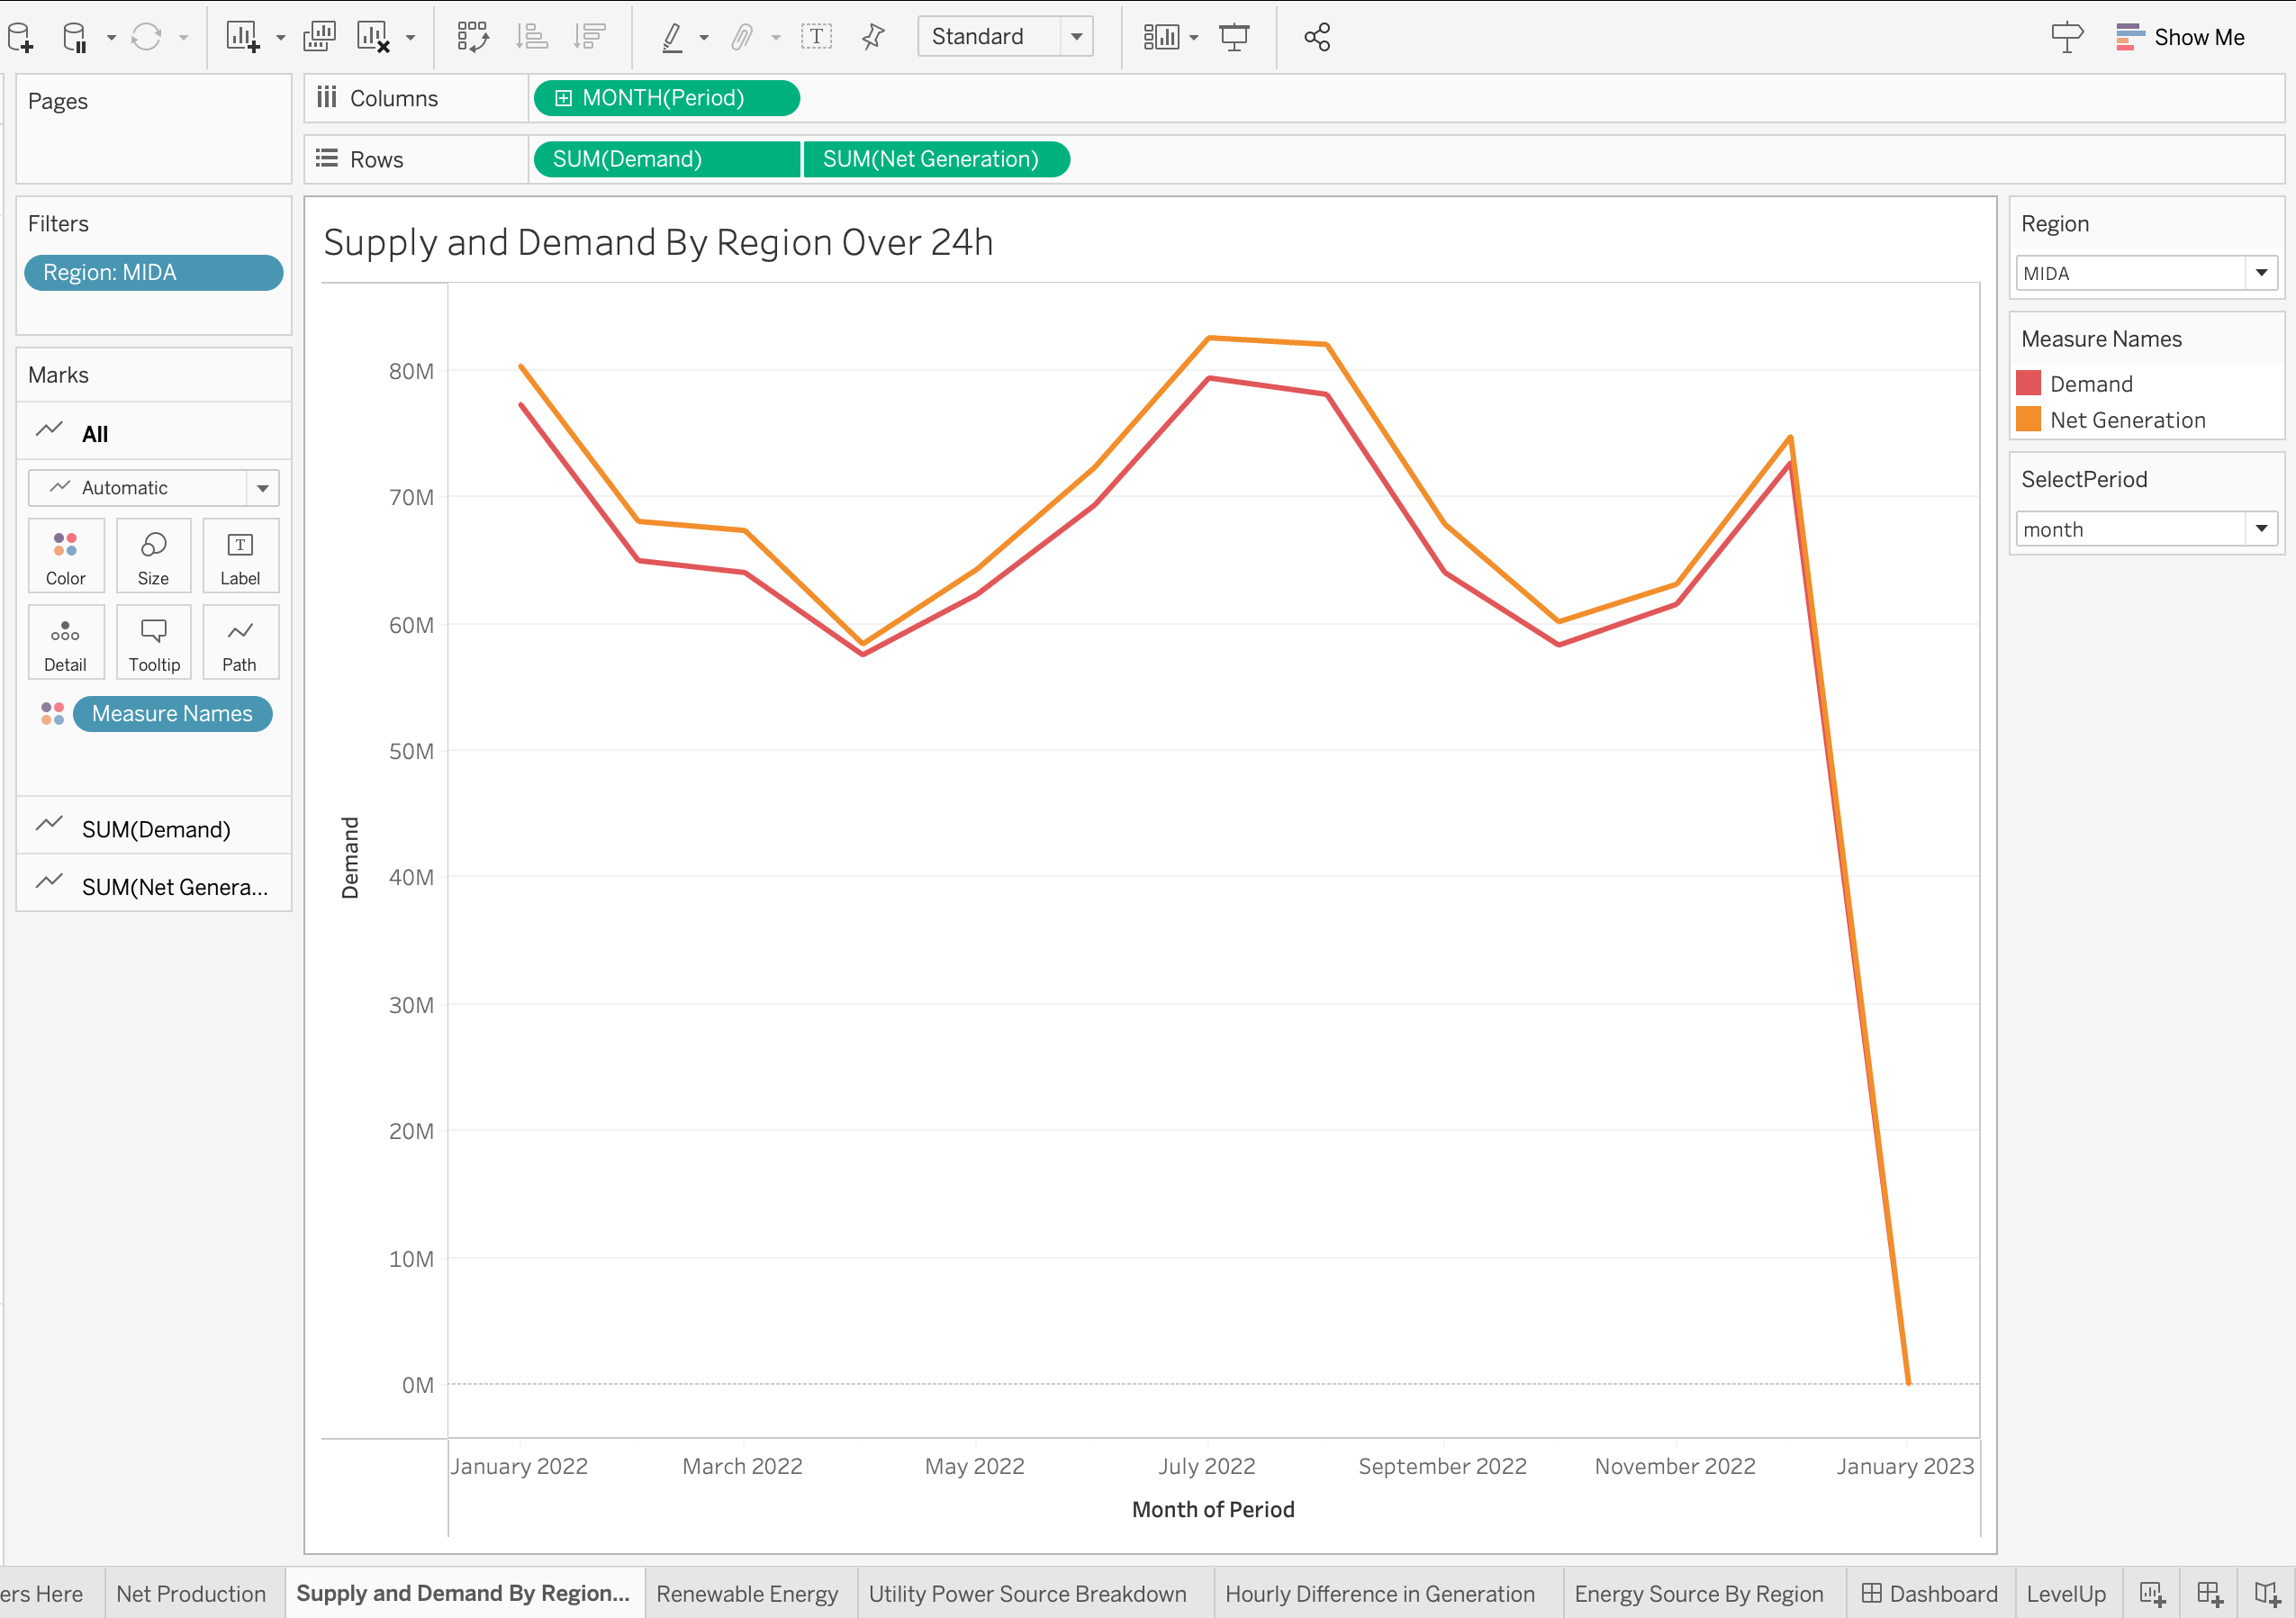
Dual-axis plots and line charts were developed to compare energy demand and net generation over time. These visualizations help identify regions with stable electricity metrics, crucial for the consistent operation of a data center.

a image of dual axis in Tableau.

Energy Source Breakdown

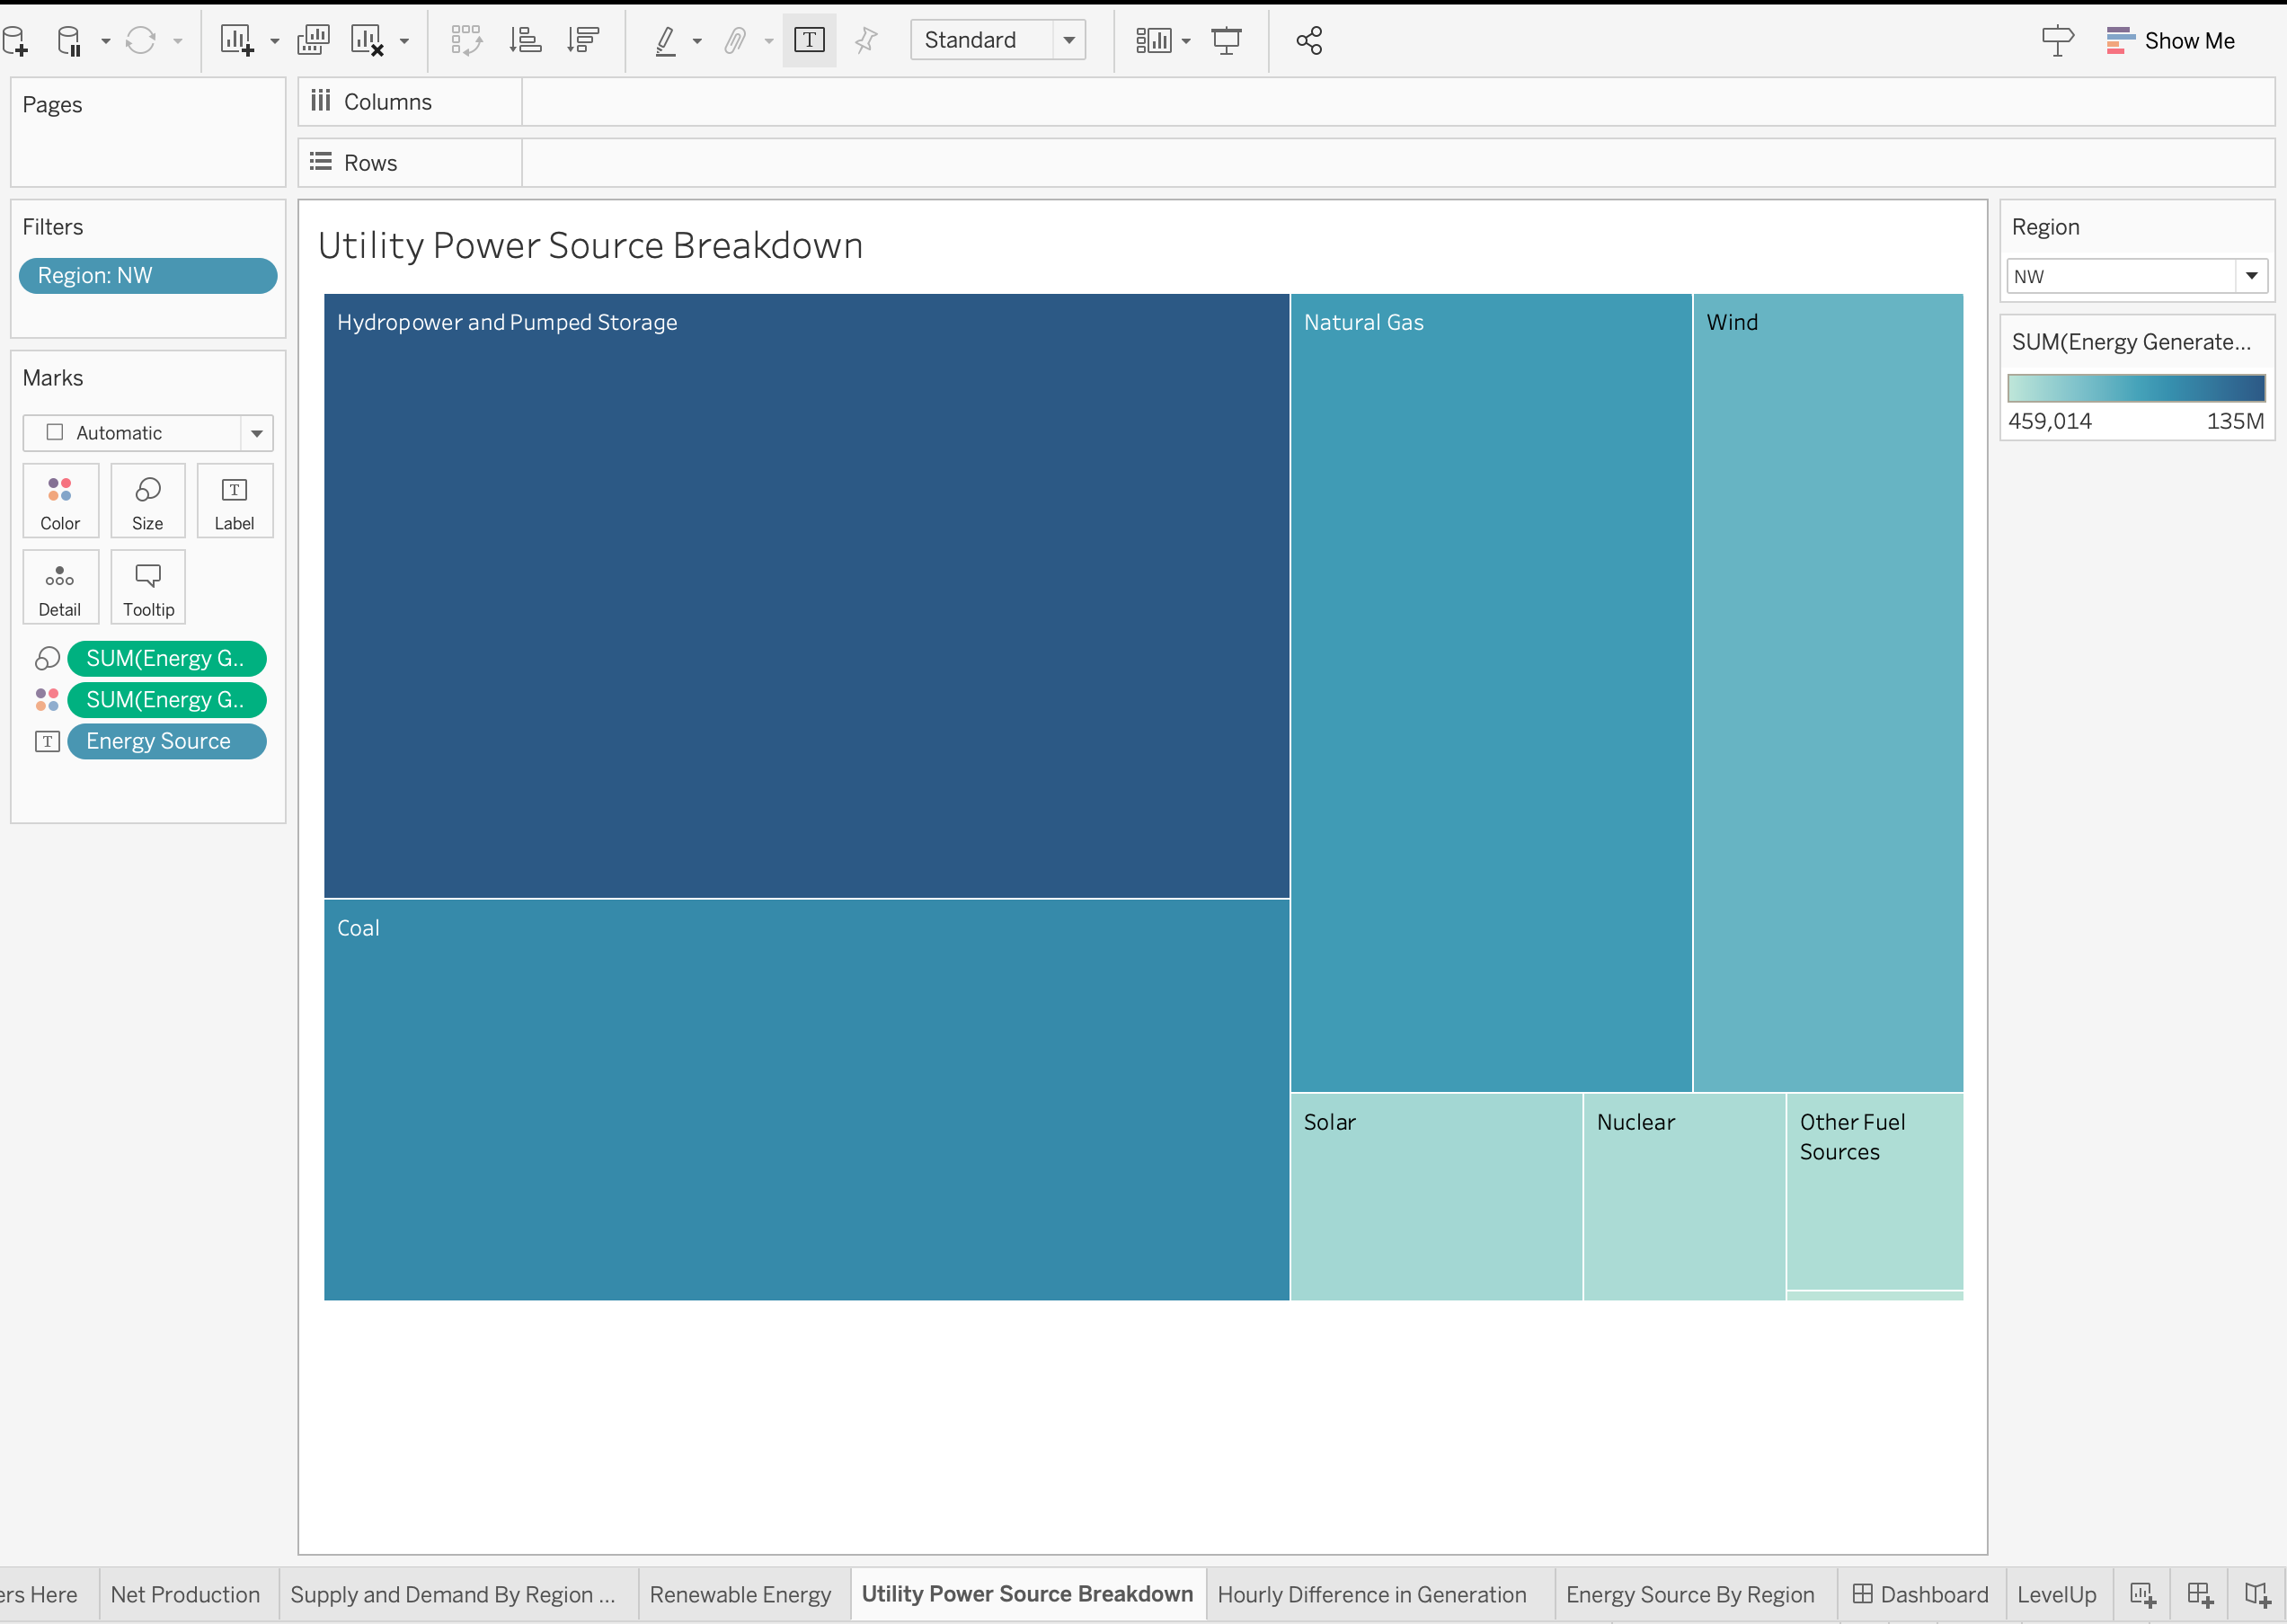
Tree maps were used to display the composition of energy sources by region, focusing on the contribution of renewable energy. This breakdown provides insight into the diversity and reliability of energy sources in each area.

a image of tree chart.  a image of a chart

Location Recommendation

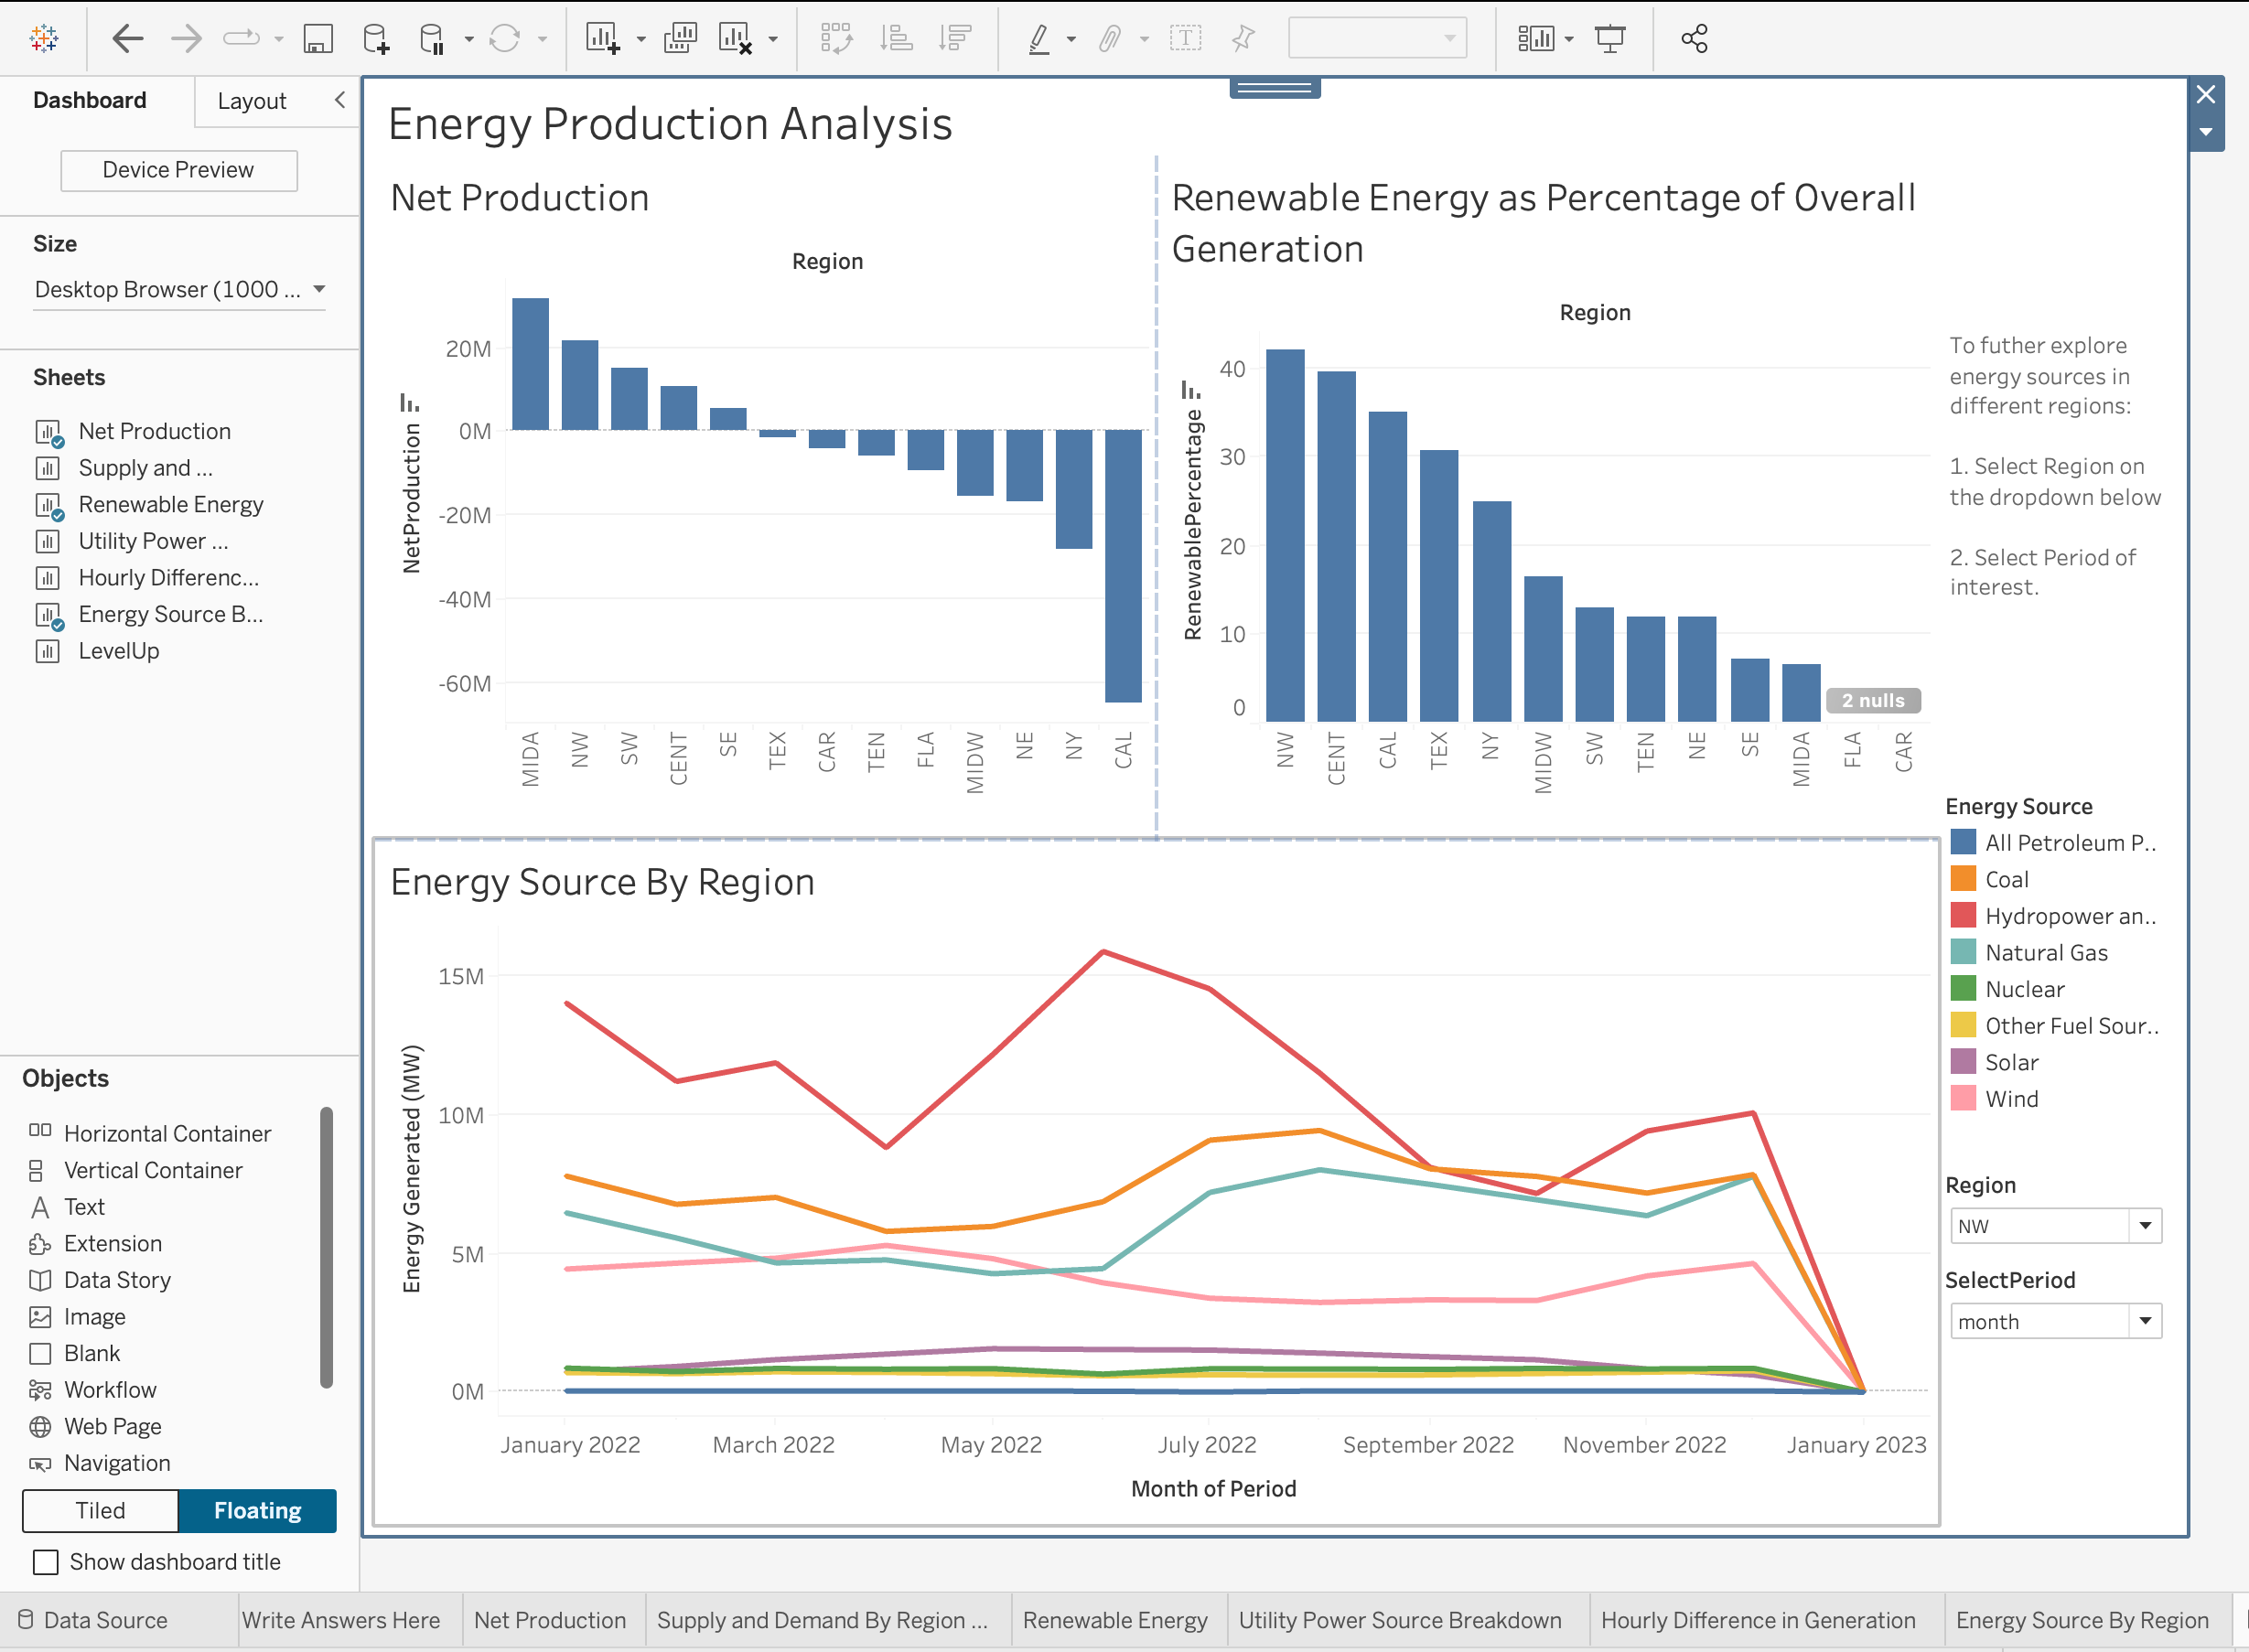
Key visualizations were compiled into interactive dashboards to provide a comprehensive and user-friendly view of the data. Based on the analysis, the recommendation is to build the new Intel data center in the Northwest region due to its high energy production, substantial renewable energy generation, and diverse energy sources.

a image of Interactive Dashboards.